


Methods and Response Rate
Learn more about the methods, participants, and rationale for this ambitious and exciting project.
The survey instrument and supporting materials were translated into 23 languages, including Arabic, Bengali, Burmese, Cantonese, Filipino, French, Greek, Hindi, Indonesian, Italian, Japanese, Korean, Mandarin, Portuguese, Russian, Spanish, Swahili, Telugu, Turkish, Thai, Urdu, and Vietnamese. The survey is implemented in Qualtrics. The outreach effort and data collection were conducted by email, mail, phone, fax, WhatsApp, and social media from January to September 2022.
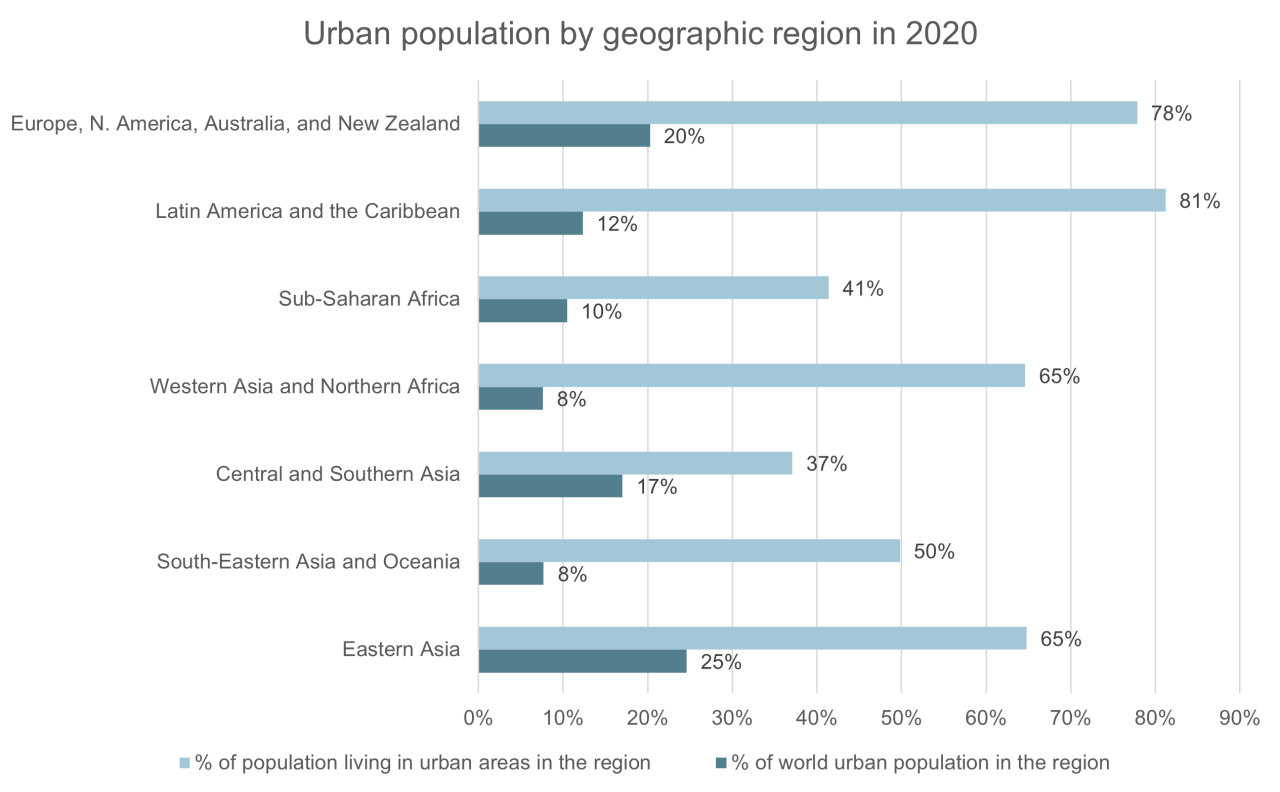
Source: United Nations, Department of Economic and Social Affairs, Population Division (2018). World Urbanization Prospects: The 2018 Revision, Online Edition.
The survey sample was drawn from a comprehensive list (maintained by the United Nations Department of Economic and Social Affairs, Population Division), of 1,860 urban agglomerations in 156 countries with a minimum population threshold of 300,000. Within each urban agglomeration, one municipality (or its political-administrative equivalent), with the largest population was selected to represent the urban agglomeration. The survey sample included 1,012 randomly selected municipalities in 125 countries and represented all of the major geographic regions of the world.
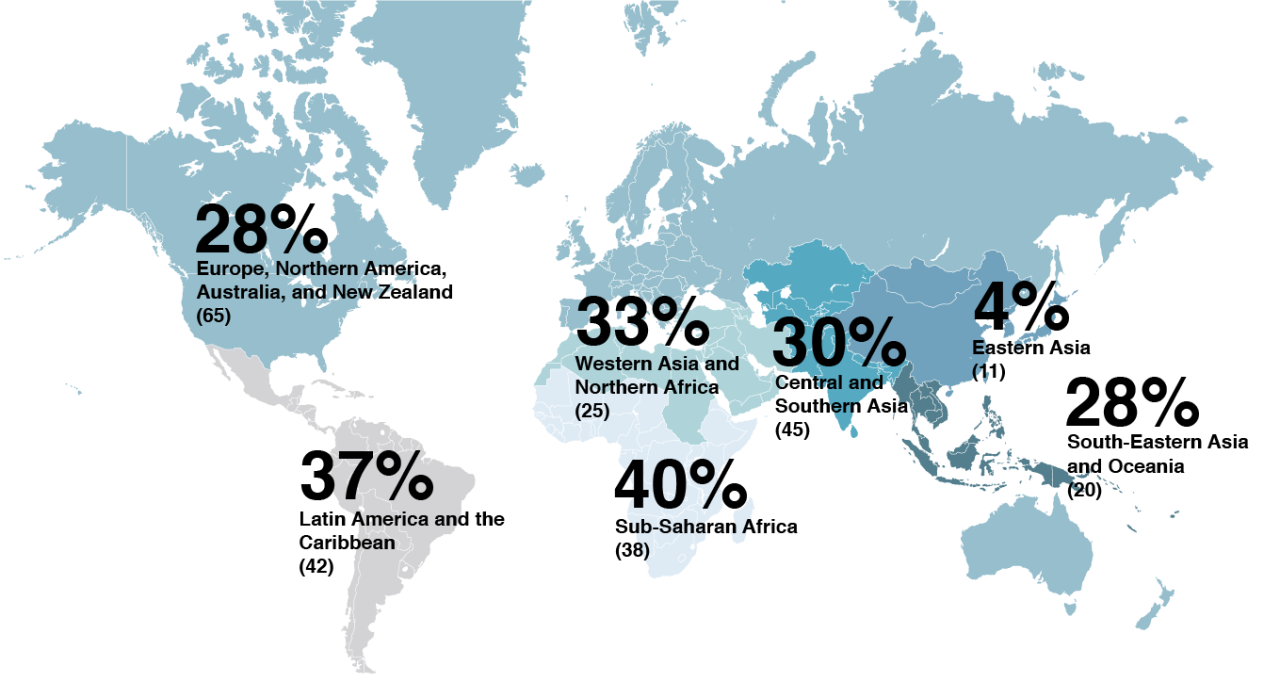
The survey respondents were executive leaders of urban local government. Depending on the national context, these leaders were either elected or appointed, and had different titles including, but not limited to, mayor, municipal commissioner, governor, town clerk, chief executive, district magistrate, chairperson, or king. The survey response rate was 24.3%.